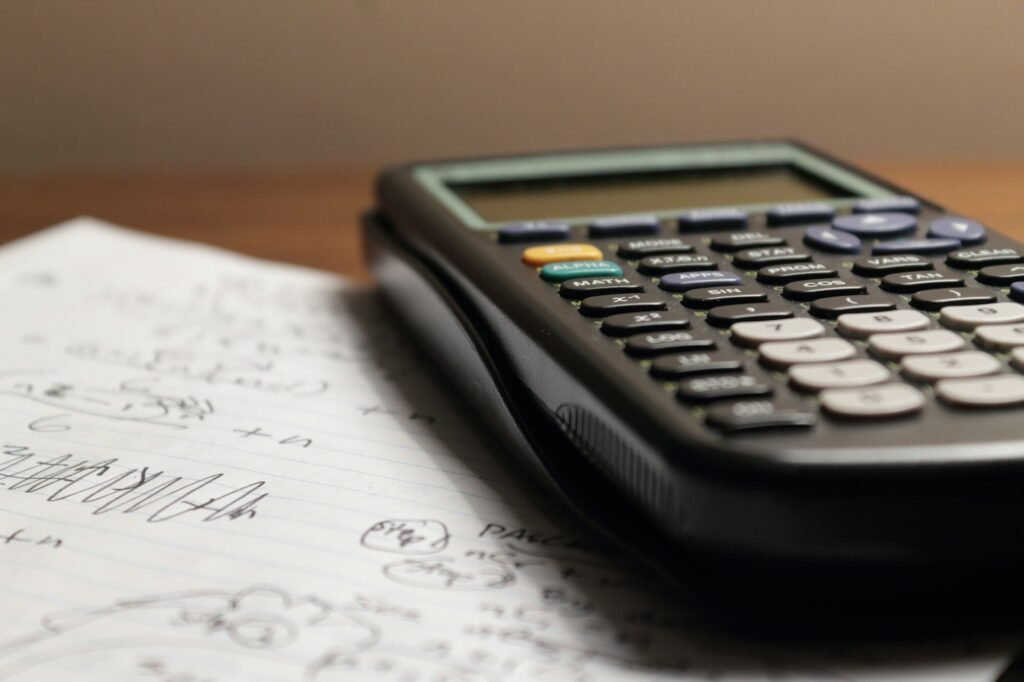
How to Make a Scatter Plot and Find the Line of Best Fit
A scatter plot shows the relationship between two sets of numbers, like height and shoe size, or hours studied and […]

A scatter plot shows the relationship between two sets of numbers, like height and shoe size, or hours studied and […]
Standard deviation is the number that tells you how spread out a set of data is. A small standard deviation […]

Mean, median and mode are the three averages you will meet in statistics class, and they tell you different things […]
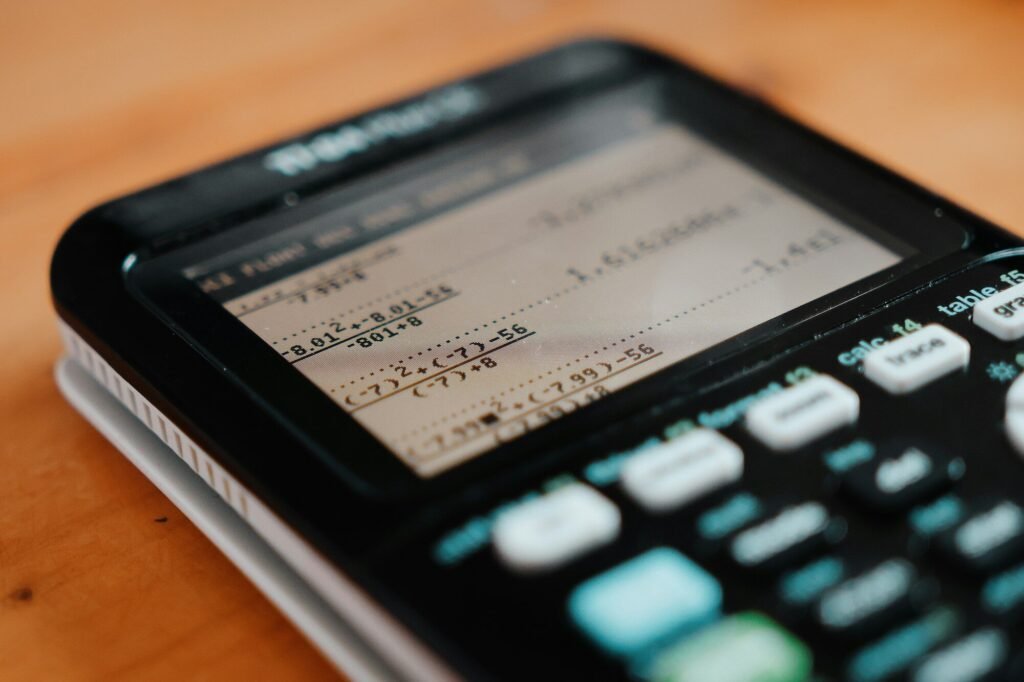
Decimals and fractions are two ways of writing the same number, and your teacher will ask you to switch between […]

Logarithms look intimidating, but they are just another way of writing a power. If 10 squared is 100, then log […]
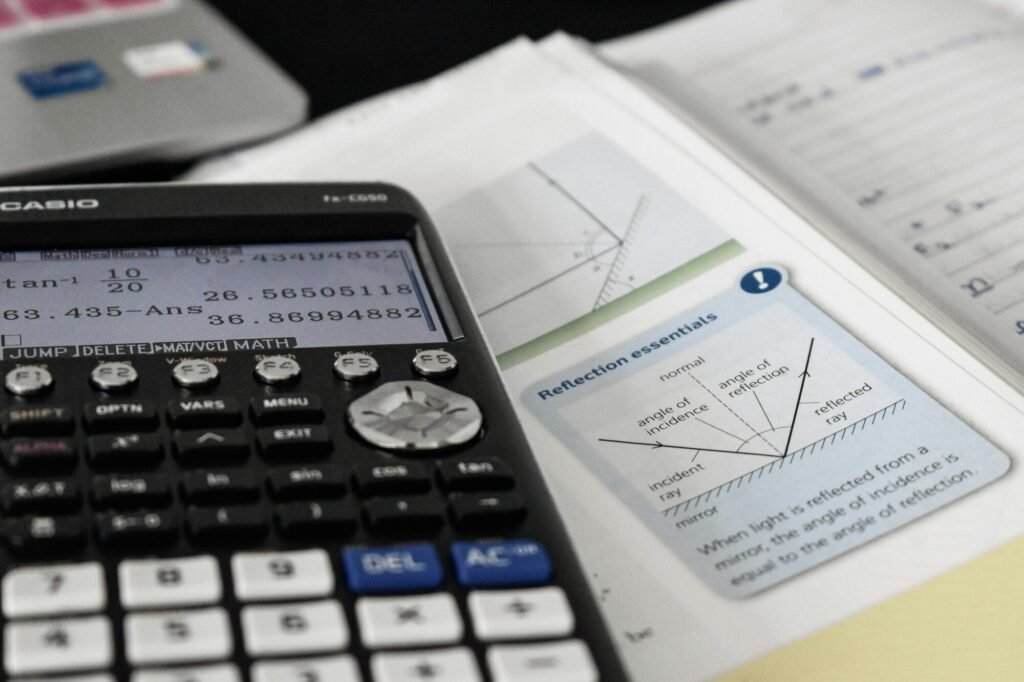
Absolute value is one of those ideas that sounds simple and then causes trouble in practice. The absolute value of […]
A system of equations is two or more equations that you need to solve at the same time, and the […]
Percentages are everywhere in school and in real life: test scores, discounts, tax, tips, interest, and growth. The maths behind […]
Powers and roots are some of the most common calculations in school maths, and the TI-84 has a key for […]
Quadratic equations show up in almost every algebra class, and they can be slow to solve by hand. Factoring works […]